This page is published to ensure transparency and to help students learn from common mistakes in academic writing and project-based reporting. Your final grade is not only a number—it reflects how consistently you met the course standards across attendance discipline, project/RTM quality, and other assessed components.
How the Final Grade Is Calculated
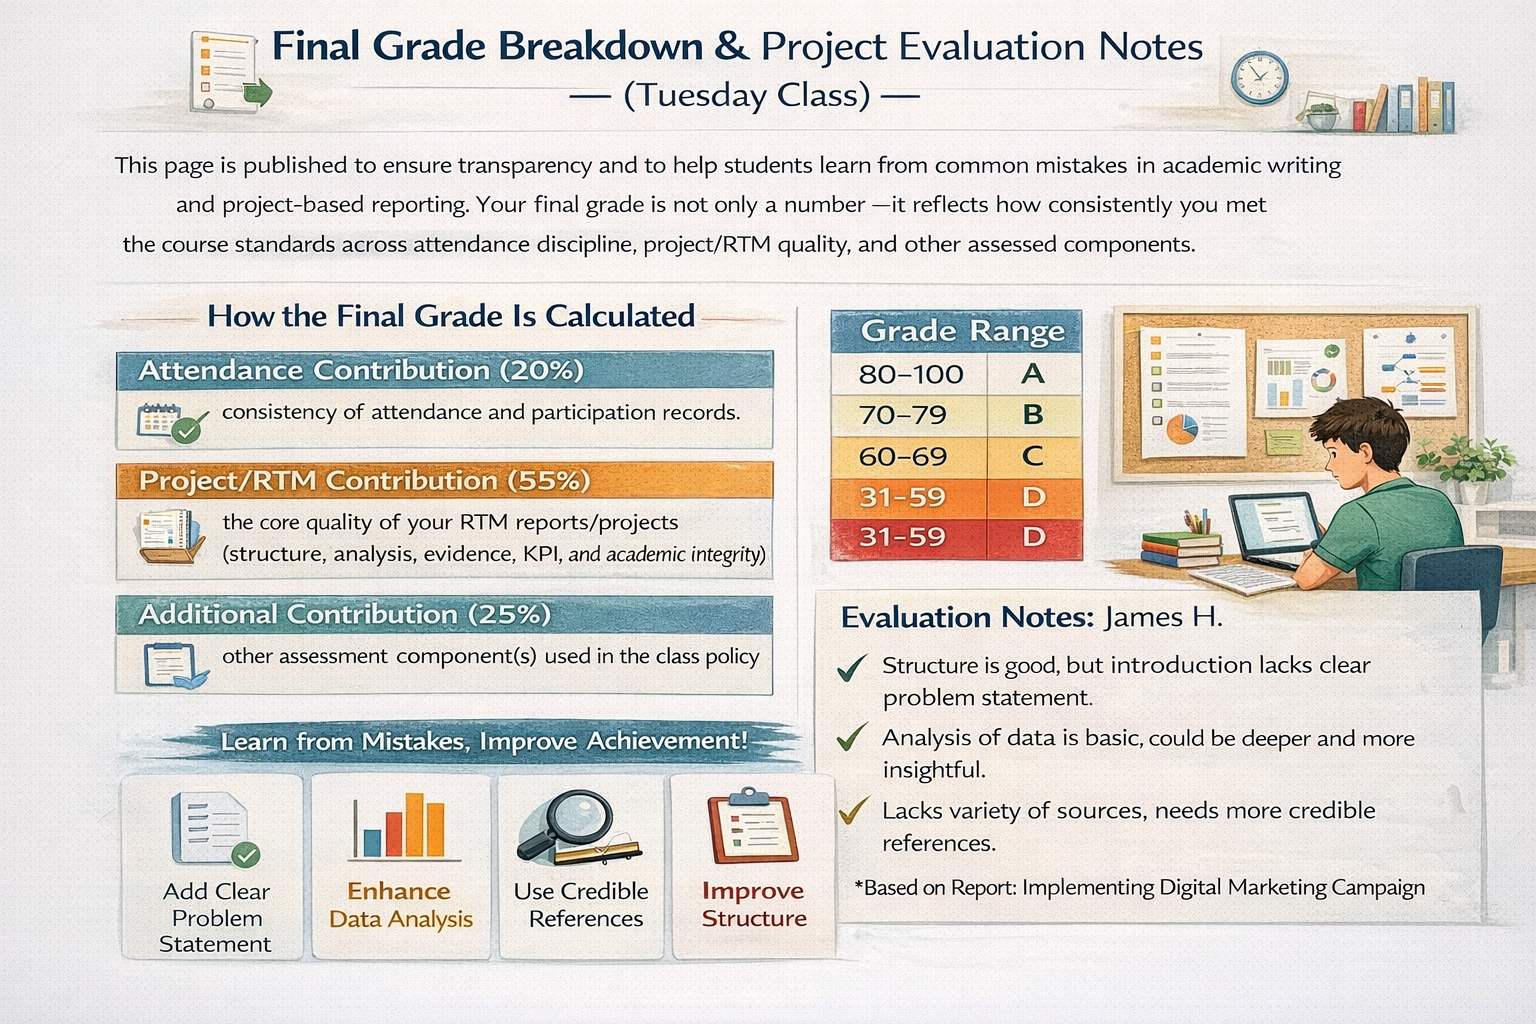
- Attendance Contribution (20%): consistency of attendance and participation records.
- Project/RTM Contribution (55%): the core quality of your RTM reports/projects (structure, analysis, evidence, KPI, and academic integrity).
- Additional Contribution (25%): other assessment component(s) used in the class policy.
Final Score = (20% Attendance) + (55% Project/RTM) + (25% Quiz)
The breakdown below is provided so each student can see which component most affected the final result.
Final Score Table (With Breakdown)
| Nama | Absensi (20%) | Project (55%) | Quiz(25%) | Nilai Akhir |
|---|---|---|---|---|
| NABILLA MARSYA | 18,67 | 47,751 | 22 | 89 |
| FANI ANGRRAINI SAFITRI ANINGSIH | 18,67 | 45,991 | 22 | 87 |
| KHALIZA FATHIA ACHMAD | 18,67 | 31,559 | 24 | 74 |
| MUAMAR NABIL DWI SAPUTRO | 12 | 29,37 | 15 | 56 |
| ALSYAFHAN DANI RAMADHAN | 18,67 | 46,904 | 17 | 83 |
| NAJWA AULIA | 18,67 | 47,8115 | 17 | 84 |
| ASYILA NAILA ALIFAH | 17,33 | 48,114 | 21 | 87 |
| NADIA SAFIRA | 18,67 | 47,8115 | 24 | 90 |
| NABILA SALSABILA | 18,67 | 31,559 | 23 | 73 |
| MUHAMMAD OKAN KHADAFI PUNY | 10,67 | 30,6185 | 23 | 64 |
| MARGARETA VERONIKA SIMALANGO | 18,67 | 47,751 | 22 | 88 |
| MUHAMMAD RAHMAN HIDAYAT | 17,33 | 47,124 | 22 | 86 |
| MUHAMMAD RIDHO NAUFAL | 13,33 | 26,5815 | 22 | 62 |
| ANDINNA DESWITA | 14,67 | 45,815 | 19 | 80 |
| FAUZIAH NUR MUTMAINAH | 16 | 15,224 | 23 | 54 |
| CUT DESI | 18,67 | 30,404 | 23 | 72 |
| AZAHRA NANDA AULIA | 16 | 15,224 | 22 | 53 |
| VITA TAMALA PUTRI | 18,67 | 45,991 | 24 | 88 |
| YOSUA NATANAEL PARDOMUAN SIMBOLON | 14,67 | 47,751 | 22 | 85 |
| JEANNY OLIVIA | 18,67 | 48,114 | 23 | 90 |
| SYABRINA RAISYA KUMALA DEWA | 17,33 | 30,404 | 24 | 71 |
| JENSEN ALDIANO | 14,67 | 41,239 | 24 | 80 |
| ELGA ARUM ANJANI | 16 | 31,559 | 24 | 71 |
| MARSHANDA | 16 | 45,815 | 12 | 74 |
| YUSUF APRILIANO P SIHITE | 16 | 29,37 | 7 | 53 |
| INTAN NURAENI | 16 | 47,8115 | 20 | 84 |
| RAJIB MUHAMMAD LATIF | 17,33 | 41,239 | 23 | 81 |
| FAARUQ KHODAFI | 17,33 | 45,8425 | 23 | 86 |
| NAYLA TSABITHA DAMAYANTI | 16 | 45,991 | 23 | 85 |
| SASKIA PUTRI | 17,33 | 45,815 | 22 | 85 |
| RICO DAMARA | 14,67 | 30,6185 | 23 | 68 |
| NGISOMUDIN | 16 | 29,7385 | 22 | 68 |
| SAHLA NABIL | 16 | 48,114 | 18 | 82 |
| FARHAN HIDAYAT | 17,33 | 47,124 | 23 | 88 |
General Project Evaluation (What Most Affects Scores)
1) The 55% Project/RTM component is the main “grade driver”
In many cases, the largest score differences came from the 55% Project/RTM contribution.
Students with strong final grades typically showed:
- clear structure (problem → analysis → evidence → decision → conclusion),
- measurable outputs (KPI/targets),
- operational recommendations (steps, timeline, risk mitigation),
- consistent academic writing.
2) Common mistakes that lowered Project/RTM scores
Across multiple submissions, recurring weaknesses were:
- Narrative-only writing (describing without measurable KPI/targets),
- generic recommendations (no “what exactly, how, who, and when”),
- weak evidence (claims without credible sources),
- inconsistent format (citations/references mixed, headings messy),
- unfinished sections (placeholders, missing tables/attachments).
3) Attendance helps—but it cannot fully “rescue” a weak project score
A strong attendance contribution (20%) supports the final score, but if the Project/RTM contribution is low, the final score will still drop significantly. The same applies to the additional 25% component: strong performance helps, but the report quality remains crucial.
Quick Improvement Checklist (Before Submitting Future Projects)
Use this as a final check:
- Is the problem specific (organization + process + measurable symptoms)?
- Did you include evidence/data (even a small dataset)?
- Are KPI written with targets and time period (not only “improve/increase”)?
- Are recommendations operational (steps + timeline + risk mitigation)?
- Are citations and references consistent (one style only)?
- Is the document final-ready (no placeholders, clean tables/figures)?